Here’s the problem… The default Return on Investment (ROI) displayed by Google Analytics is misleading for two reasons.
Issue 1: Google Analytics combines revenue from your transactions and goals. That can lead to double counting, if for example, an add-to-cart click is a monetised goal.
Issue 2: Google Analytics has no idea about what profit margins you operate under – how can it? Google therefore has to assume that *ALL* revenue generated by your visitors is 100% profit.
In this post I show you how to avoid these issues and calculate your AdWords REAL ROI. Its purpose is to take you to the next level – allowing you to move beyond adjusting bids simply based on conversions. Instead, you can go after the “highest” value converters.
Note this post 1 of 2 aimed at AdWords account managers who need a much greater understanding of how to optimise campaigns. By nature, this is deep dive analytics, but it is not technical – no coding required! Post 2 (coming soon!) shows you how to use the REAL ROI calculations to do this. If you use a bid management tool this article will help you understand the methodology employed behind it.
How Google Analytics Calculates ROI
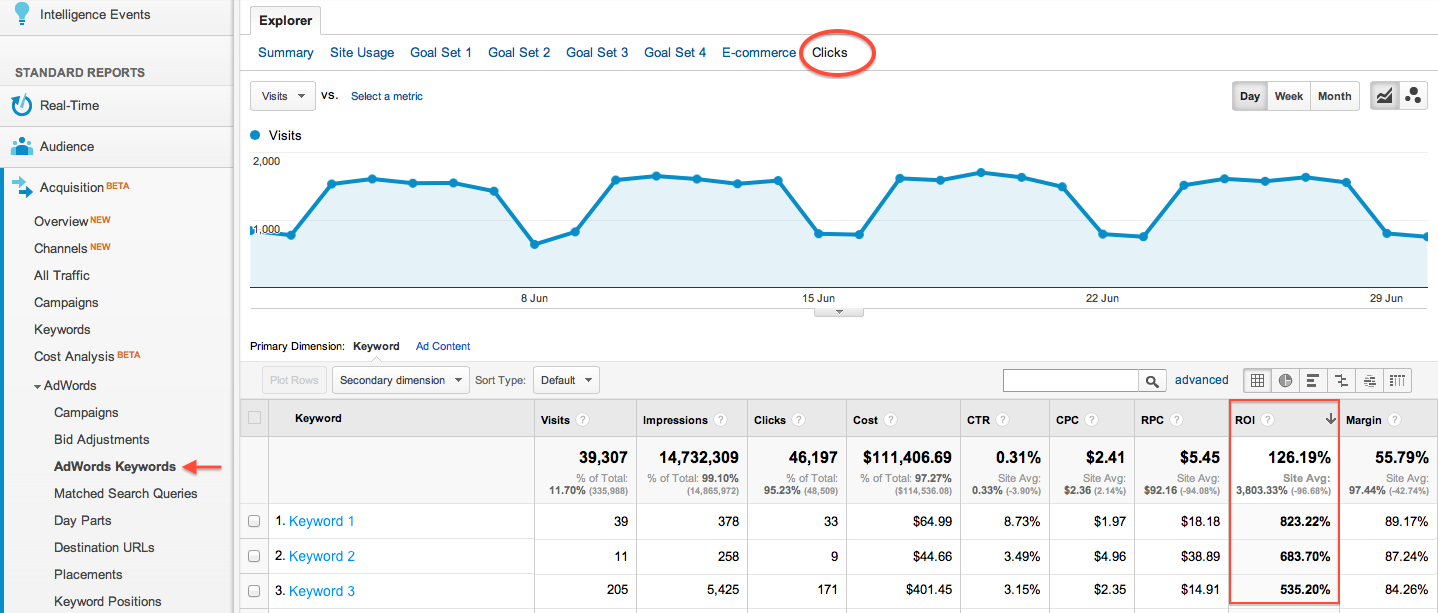
An example Google Analytics AdWords ROI report is shown in Figure 1. The ROI column is calculated as follows and expressed as a percentage (historically ROIs are expressed as a percentage though for clarity the calculation omits this):
ROI = (revenue – cost) / cost
This means if your ROI is reported as 500%, you are receiving a $5 return for every $1 spent on AdWords. Assuming your revenue is $600 from $100 spent, the calculation is simple:
ROI = (600 – 100) / 100
ROI = 500%
A negative ROI means you are spending more than you are making. For example, ROI = (50 – 100)/100 = -50%.
Figure 1 – Example default ROI values for AdWords keywords in Google Analytics (click for full size)
From Figure 1 there are two important issues you need to be aware of:
Issue 1
If the purchase of a product on your transactional site also captures goals that are monetised (e.g. add-to-cart is a goal that you have configured a goal value for), you will have both e-commerce revenue and a goal value captured for a single transaction. The default ROI calculation performed by Google Analytics includes ALL revenue (transactions + goal values). To avoid the double counting you need to separate these values out and re-calculate the default ROI. Use your revenue and cost data along with the standard ROI formula. That said, calculating your REAL ROI is a much better option…
Issue 2
From Keyword 1 shown in Figure 1, a reported ROI of 823% suggests you can spend 9x as much on your AdWords advertising and still make more than you spend (i.e. maintain a positive ROI). Clearly this is flawed. What if your profit margin is only 40% of your sales price? i.e. 60% of your sales price is for your materials/manufacture/purchase price. This of course changes your ROI calculation and I refer to this modification as your REAL ROI.
OK, now we know the default ROI values in Google Analytics are redundant so we need to modify the calculation for the real-word… BUT, before doing this, how significant is the difference? As you can see in Figure 2, we are not tweaking the edges here!
Figure 2 – How big a difference is the Google Analytics default ROI versus the REAL ROI? Data taken form Table 1.
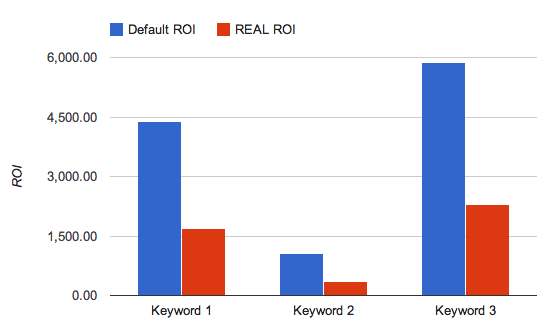
The differences are substantial e.g. for Keyword 1, its a difference of 2,700%…! Calculating your REAL ROI is therefore a must step. It takes the information available in GA to another level – one that reflects the real-world situation. This will have a significant impact on how you optimise your AdWords accounts.
Calculating your REAL ROI
Assuming the same revenue and cost figures as for the first example, if your profit margin is 0.4, your REAL ROI is calculated as follows:
REAL ROI = (revenue × margin – cost) / cost
REAL ROI = (600 × 0.4 – 100) / 100
REAL ROI = 140%
Simple right! This means you can afford to spend up to 140% more money (2.4 times as much) in AdWords without producing a negative ROI. That’s good news, though a very different figure from the 500% that would be shown in your Google Analytics reports by default.
Note that when a keyword does not generate any revenue (zero revenue), its ROI and REAL ROI values always calculate as -100%.
Now lets perform this calculation with real data. Essentially there are 3 steps:
Step 1: Get the raw data into a custom report (I have the templates for you)
Step 2: Export the data into Google Docs spreadsheet (two clicks!)
Step 3: Apply my formulas to calculate your REAL ROI (cut & paste from my demo sheet)
I split these steps into two examples, depending on whether you manage a transactional site or non-transactional site. A transaction site is easier to calculate for as the metrics can be pulled directly from your GA reports. A non-transactional site just needs a little lateral thinking, which I explain below…
A) REAL ROI for a Transactional Site
Table 1 is what we are going to build using a custom report and Google Docs. Table 1 shows the numbers when a profit margin of 40% is assumed for a transaction.
Table 1 – Comparing REAL ROI versus the default ROI from Google Analytics (transactions). Values taken from Figure 3.
| Product Revenue | Profit Margin |
Default ROI |
REAL ROI (revenue × margin – cost)/cost |
|
| Average | 27,000.72 | 0.4 | 3,113.06% | 1,185.21% |
| Keyword 1 | 15,010.75 | 0.4 | 4,383.90% | 1,693.56% |
| Keyword 2 | 856.36 | 0.4 | 1,059.44% | 363.77% |
| Keyword 3 | 1895.00 | 0.4 | 5,862.87% | 2,285.15% |
[sidebar] Table 1, assumes a fixed profit margin for each purchase. However, you can adjust this on a per product basis, and even time basis i.e. maybe you have different margins during the summer sales. To look at ROI of a per product or category basis, apply an advanced segment e.g. include product category = widgets [/sidebar].
Lets get started…
Step 1: Get the raw data into a custom report
You can build your own equivalent of Table 1 by obtaining values form two GA reports – the “Clicks” tab for cost and default ROI data, and “E-commerce” tab for revenue and conversion data. However, to simplify matters I have created a custom report to combine the required metrics into one report – see Figure 3. Download the custom report template and apply it to your e-commerce data. Your report view will match Figure 3 with different numbers of course. If required, Chapter 9 of the book describes the process of building custom reports with examples.
Figure 3 – Custom report for REAL ROI transactions – download this template (trans)
![]()
[sidebar] Figure 3 has additional columns that are not required for your REAL ROI calculations (Average Price, Conversion Rate). However, these are included here for use in my next post on how to actually use your REAL ROI to optimise your AdWords campaigns. [/sidebar].
Step 2: Export the data into Google Docs spreadsheet
Expand the number of data rows in your custom report as needed – the default is 10 but you can select upto 5,000. Now export your custom report data into Google Docs.
Step 3: Apply my formulas
Once the data is displayed, cut and paste my formulas (columns H-J) into your exported spreadsheet. My spreadsheet is “view only”, therefore save your own copy to play with.
Adjust the profit margin column accordingly (I use 40%). Notice that in my spreadsheet I have re-calculated the default ROI (column H) using only the e-commerce revenue data. This is to exclude monetised goals from the default calculation – avoiding Issue 1, described at the start of this article.
Voila – Your REAL ROI is calculated for you.
Figure 4 – Completed REAL ROI spreadsheet for transactions – you need to be signed into your Google account to view this image. Click to open in Google Docs
That’s all there is to it…!
Now imagine the power at your fingertips by applying REAL ROI at the individual product level (different product margins) AND keyword level (different conversion rates). It gives you very precise control for optimising your AdWords account…
You can now read the slightly more complicated process for non-transactional sites, or skip to the So What…? section below.
B) REAL ROI for a Non-Transactional Site
As alluded to earlier in this post, a non-transactional site needs a little lateral thinking as there are two potential gotchas here that you need to be aware of…
- When you have designed your GA setup to capture multiple engagement points – that is, you have multiple goals configured that are aimed at the same visitor. The issue is, what to do if completing Goal 2 also triggers Goal 1…? For example, “registration started” (G1) followed by “registration completions” (G2). The second goal depends on the first and so including all completed goals in your REAL ROI calculations will result in double counting.
- You have a mix of goals that are monetised and some that are not. Clearly, including non-monetised goals will dilute your REAL ROI and so these need to be omitted.
In my example REAL ROI calculation below I assume ALL your goals to be monetised and independent. It’s not a big problem if that doesn’t describe your situation. If you have non-monetised goals and/or dependent goals, simply adjust the custom report I provide below to only consider a specific monetised Goal(NN). You can also add multiple independent goals – just sum the goal values and goal completions for the REAL ROI calculation.
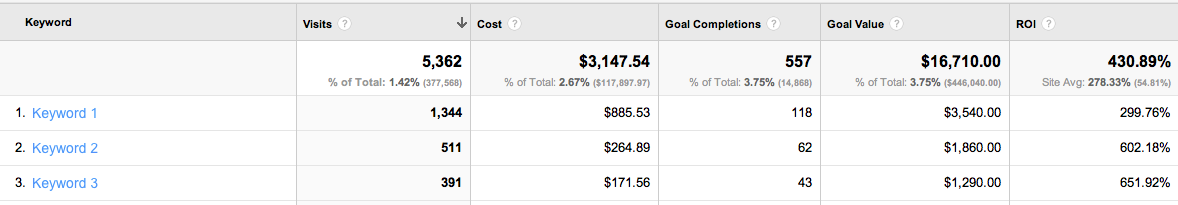
Table 2 is what we are going to build using a custom report and Google Docs. Table 2 shows the numbers when a profit margin of 40% is assumed for a goal.
Table 2 – Comparing REAL ROI versus the default ROI from Google Analytics (goals). Values taken from Figure 5.
| Goal Value | Profit Margin |
Default ROI |
Real ROI (goal value × margin – cost)/cost |
|
| Average | 16,710.00 | 0.4 | 430.89% | 112.36% |
| Keyword 1 | 3,540.00 | 0.4 | 299.76% | 59.90% |
| Keyword 2 | 1,860.00 | 0.4 | 602.18% | 180.87% |
| Keyword 3 | 1,290.00 | 0.4 | 651.92% | 200.77% |
As before, this is a 3-step process for your goals…
Step 1: Get the raw data into a custom report
You can build your own equivalent of Table 2 by obtaining values form the separate GA reports. However, as for the transactional example, I have simplified matters by creating a custom report to combine the required metrics into one report – see Figure 5. Download the custom report template and apply it to your goal data. Your report view will match Figure 5 with different numbers of course. If required, Chapter 9 of the book describes the process of building custom reports with examples.
Figure 5 – Custom report to simplify the REAL ROI calculation – download this template (goals)
[sidebar] In Figure 5 there is an additional column shown in the report that is not required for your REAL ROI calculations (Goal Completions). However, this is included here for use in my next post on how to actually use your REAL ROI to optimise your AdWords campaigns. [/sidebar].
Step 2: Export the data into Google Docs spreadsheet
Expand the number of rows in your custom report as needed – the default is 10 but can select upto 5000. Now export your custom report data into Google Docs.
Step 3: Apply my formulas
Once the data is displayed, cut and paste my formulas (columns G-I of Figure 6) into your exported spreadsheet. The spreadsheet is “view only”, therefore save your own copy to play with. Adjust the profit margin column accordingly (I use 40%). Voila – Your REAL ROI is calculated for your goals.
Figure 6 – Completed REAL ROI spreadsheet for goals – you need to be signed into your Google account to view this image. Click to open in Google Docs
That’s all there is to it…!
[I have said this bit before, though I say it again for those that skipped section A… ]
Now imagine the power at your fingertips by applying REAL ROI at the individual product level (different product margins) AND keyword level (different conversion rates). It gives you very precise control for optimising your AdWords account…
So What…? How do I use REAL ROI…?
The “so what?” is a question I encourage all analysts to respond with when asked to perform tasks that require thought, time, and energy to produce. In order words, something that a user cannot get for themselves by having access to Google Analytics reports. A more subtle way of putting it is:
“What is the benefit of doing this and what will you do once this number/calculation/analysis is performed? “
If those questions are not easily answered, consider binning the request…
For this post, you use the REAL ROI to optimise your AdWords advertising budgets properly. Its purpose is to take you to the next level – allowing you to move beyond adjusting bids simply based on conversions. That is, optimising for conversions is a great first step (please don’t rely on ad click-throughs), however it assumes all conversions/sales are equal. Obviously they are not in the real-world. Using your REAL ROI allows you to focus your budgets on acquiring the “highest” value converters.
In my follow up post – coming soon – I described how you can use your REAL ROI numbers to optimise your AdWords account (it was too much detail to put all in one post!).
No, actually AdWords ROI calculation is based on real ROI. In this page, https://support.google.com/adwords/answer/1722066?hl=en
ROI calculation also takes into account the cost of goods sold, which is the cost of manufacturing, distribution, shipping, and any other fixed/variable cost associated with the product. The AdWords cost is added to it. So, it’s effectively calculating the real ROI.
Not saying that this article gives it wrong. Here, Google ROI calculation is assumed to be taking only the Google advertising cost into account.
Hello Lenin – I think you are mixing up my post on Google Analytics reporting with what are the latest capabilities within the Adwords platform itself. Within GA, there is no simple way to calculate a real ROI. Maybe that will change soon to match what can now be done in Adwords…
Hi,
I am trying to work out my real ROI – we also have postage costs associated with each online sale – therefore, would I be right to also remove that from my revenue (so using my Net Profit)?
If I do, then I also need to know how many sales occurred – now, should I use Analytics “Transactions” for this number, or my Adwords tracked Conversions – which will give a truer reflection of ROI?
Thanks for your help! Getting a bit confused!
@Sarah – when calculating your profit margin I recommend you exclude all expenses that are related to the sale. So yes, exclude shipping costs.
AFAIK Adwords still uses a third-party cookie. These are much more likely to be blocked than the default first-party cookie of GA. Therefore, stick to GA for you transaction numbers.
BTW, please add your input to this poll: https://brianclifton.com/blog/2016/02/17/3rd-party-cookie/. The “related articles” section at the bottom of that post will give you more background info on cookies and privacy.
I agree that the ROI displayed by Google Analytics is misleading, but I ran across another article that tackles actual ROI from a different angle. Your ROI from AdWords is Higher Than You Think It’s simple and really makes sense to me. It certainly would explain why we’ve gotten such great results. Thoughts?
Interesting find +Dan. My article is about using profit instead of gross revenue for understanding the performance of Adwords – obvious of course, but there is currently no way to do this in GA – though I am investigating 😉
David’ article is about looking at the cumulative return – that is also important. A couple of follow up pointers form me:
-In both these articles only the last click is considered. The reality if that Adwords is probably impacting conversions where it is not the last click. Take a look at Multi-Channel Funnels reports for this. You can also find a case study on this exact same issue in Chapter 10 of Successful Analytics… 😉
-Cumulative return assumes the return form Adwords is constant for a long period of time. For most e-tailers there are spikes e.g. Christmas, and the success (or not) of that spike is critical…
Brian, Great post (also am reading your 3rd edition book – superb)
What bothers me about PPC ROI calculations like this is that it’s done without consideration of the effects of organic listings that are on the same results page. PPC listings are given credit for visits that would have happened anyway, if there happens to be an extremely high organic listing right below the paid listing. This is the case for many brand terms. To really understand the payback of PPC, the cost per click should be calculated as the PPC spend for that term divided by the number of clicks that PPC gets over and above what organic listings would have gotten by themselves. Depending on the cannibalism rate, the actual cost per click can be significantly higher than the nominal cost.
I could expand on this, but I’ll stop there. (I can hear sighs of relief) Comments?
Hi there Brian,
My Friend Yehoshua wrote this month too a related post about tracking the real ROI using Universal Analytics it worths giving it a read:
http://www.analytics-ninja.com/blog/2013/08/measuring-profit-using-googles-universal-analytics.html
Btw, great post as usual, waiting for that follow up post 🙂