I was reading an old conference program last week, looking for inspiration to write the program foreword for the excellent upcoming Superweek data event, when I came across the wisdom of my friend and former colleague Avinash Kaushik. Essentially he was stressing the need for analysts to be a part of the business, not simply be a data monkey:
” We, Analysts, feel we are in the business of providing data (well segmented custom reported calculated metricked data for sure!). But, still just data… The best data analysts are in the business of business. ” -Avinash
It sounds so simple (and it is), yet I continuously come up against smart people with responsibility for data who remain waaaay too focused on data points, rather than the business they support. A good example of this is the confusion that is stirred up when discussing KPIs…
What Is a KPI?
Its an obvious acronym everyone I meet in business is aware of, but the definition of what a key performance indicator actually is appears to get lost in translation. Here is my definition, taken from Advanced Web Metrics (3rd Ed):
In web analytics, a key performance indicator is a web metric that is essential for your business’s success. The emphasis here is on the word essential. If a 10% change—positive or negative—in a KPI doesn’t make you sit up and call someone to find out what happened, then it is not well defined. Good KPIs create expectations and drive action, and because of this they are a small subset of information from your reports.
So what’s the big deal?
The problem (as reading Avinash’s comments reminded me), is that “business’s success” gets forgotten. In fact, it is so regularly forgotten that I need to replace my emphasis. When running brain-storming KPI workshops with clients, I often end up being given a list of interesting data points—what I refer to as signals—for my opinion on. For example, data that the SEO manger should be aware of; information showing the performance of the latest ad campaign; percentage of visitors using the site-search box, and so forth. The result is I then have to stress that these are signals only. They are informative data points to the person responsible for creating/managing them, but nonetheless they are not KPIs for the business.
Here’s my schematic analytics data stack to illustrate my terminology:
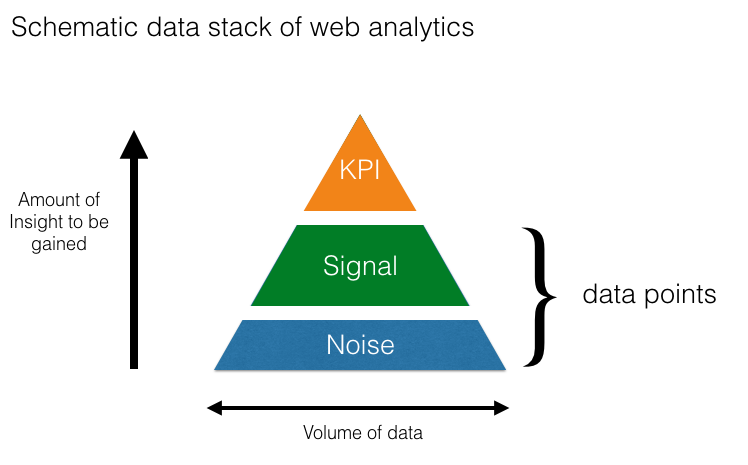
Notes for my data stack diagram:
- Noise isn’t junk data – any spam should be filtered out and binned. Rather, noise is data that is simply not of interest (or relevant) right now. It may be of interest at a later date, or if your analysis produces a curve ball. So in effect noise and signal are interchangeable depending on your current focus. However they should always be separated out.
- Signal is your interesting i.e. informative and relevant data. It tells you something about what is happening and it is what analysts look at day-to-day i.e. short time-frames. For example, a spike in visitor or customer acquisitions; the number of file downloads per day; the performance of a specific marketing campaign; number of transactions, daily revenue etc. A signal is information—its what analysts build their hypothesis (story) on.
- KPIs—as I defined above—are your method to measure the performance of your long-term objectives, typically 12 months. Once determined they should not be modified, otherwise you lose the ability to make any long-term comparison (new KPIs can of course be added, or replace old ones). Naturally KPIs are data points as well. However they are special set, often a combination of metrics specific to your organisation i.e. not lifted direct from your reports. Hence I don’t refer to them as “data points” in the general sense.
Of course my data stack diagram is not to scale. Noise in reality is much, much broader and thinner, representing perhaps thousands of different metrics and dimension combinations. Signals will be fewer in number, perhaps representing a hundred metric/dimension combinations. KPIs should be very few—less than ten for any particular stakeholder. Less is more when it comes to KPIs—for example five could be very effective for a non-transactional site (remember segmentation of your KPIs will result in more than five KPIs to monitor!).
Re-emphasising The KPI Definition
Note my original definition above has not changed. However, I wanted to expand on the important parts:
1. Who are KPIs intended for?
The business, business, business! In other words NOT people with day-to-day responsibility for the performance of a campaign or the website. Rather, your stakeholders and leadership team. These people are not Google Analytics users and they should not need to use Google Analytics to understand what your KPIs are. That said, stakeholders are still likely to be analytical thinkers themselves.
Produce KPIs by job role
That is, once your stakeholder group has agreed on a common set of high-level KPIs for the business as a whole, each stakeholder has their own KPIs more specific to their role within the organisation. For example: Sales Stakeholder; Marketing & Communications Stakeholder; Product Stakeholder; Customer Retention Stakeholder, and so forth.
Make you KPIs hierarchical
Segment your KPIs depending on the managerial level of your audience. That is, KPI reports for the CMO will differ in segmentation detail form those who work within his/her team. Generally, the higher the managerial level the less segmentation required.
Avoid mixing signals with KPIs
Sure, your digital marketing team will need their own key metrics to measure their efforts. These will be fluid, in that they are likely to change regularly on short time-frames. They will be detailed, as by definition they will capture subtle changes. And in some cases the data points will confirm negative results i.e. rule out a certain hypothesis of visitor behaviour. These are important data points. They are the signals your digital team watch as their feedback mechanism for their day-to-day work. They are not KPIs.
2. What constitutes “essential” for a KPI?
As I state in my definition, a very good rule of thumb I use is a 10% change—positive or negative. For example, if your conversion rate (converting a prospect to a new lead or customer) changes by 10% it should make your stakeholder sit up and call someone to find out what happened. Would your stakeholder mind if you called them at 7pm to tell them of this change? If not, its a great KPI. If the thought of calling your boss in the evening to discuss KPI changes fills you with dread, then its certainly not a KPI.
BTW, calling your stakeholder at 7pm to give them the news that their KPI is dropping still makes you a hero. Spotting a problem early could save the company a lot of money…
3. Purpose: Whats the point?
The purpose of KPIs is to communicate the important events that are happing to senior management—those with vested interest in the outcome. Therefore by definition a KPIs purpose is to drive strategic change. That is, enable the business to make informed decisions—and that happens over long time frames (for example, you cannot change a product overnight). Nice to know data can be very interesting to the digital team and can even be the basis of a staff bonus system. However, avoid the common pit fall of thinking that interesting data is a KPI.
By maintaining focus on these three important points, you will gain traction with senior management and build your case for change. Form your point of view, that may be the business investing more in your team!
Things to consider when defining KPIs:
- Try to use monetary values where possible; everybody understands $$$.
- If not a monetary value, use a ratio, percentage, or average, rather than the raw number. This allows data to be presented in context.
- A KPI needs to be temporal, that is, time bound. This highlights change and its speed.
- A KPI drives business-critical actions. Many things are measurable, but that does not make them key to your organisation’s success.
Use KPIs to put your data into context. For example, saying “we had 10,000 visitors this week” provides a piece of data, but it is not a KPI because it has no context. How do you know whether this number is good or bad? A KPI based on this data could be “our visitor numbers are up 10 percent month on month.” This is a temporal indication that things are looking good over the time span of one month. In this example, the raw number should still be part of the KPI report, but it is not the KPI itself.
The vast majority of KPIs are ratios, percentages, or averages. However, sometimes a raw number can have a much greater impact. Consider the following examples:
- Our website lost 15 orders yesterday because our e-commerce server was down for 34 minutes.
- We lost $10,000 in potential revenue last week because our booking system does not work for visitors who use Firefox.
- We spent $36,000 last month on PPC keywords that did not convert.
Clearly, knowing whether any of these numbers are increasing or decreasing and what fraction of the total they represent is important, but the impact of these raw numbers is far greater at obtaining action and therefore should be the KPI in these examples.
The key point is that you should develop KPIs relevant to your particular business and your stakeholders. Any metric, percentage, ratio, or average that can help your organisation quickly understand visitor data and is in context and temporal should be considered a KPI.
Setting KPIs for a local government organisation like a council is problematic, because they spent ratepayers money to provide a service. And I think your “(a) business stakeholders were not involved in setting objectives, goals and KPIs at the outset, so KPIs do not accurately reflect what the stakeholders understand as critical to the organisation’s success” is a perfect example of this.
How can you measure whether a community feels good about itself, is safe, and the residents love living there, through the organisation’s website. Most senior leaders see analytics as data points, not using them as pointers to making strategic decisions. Any ideas would be appreciated on how to turn leaders thinking around and what sort of KPIs would work in a local government arena.
An interesting point for community websites. I’d say it would be over-stretching the point in trying to assess “How can you measure whether a community feels good about itself, is safe, and the residents love living there” via your website’s analytics tool.
Those “qualitative” questions would be best assessed via a visitor survey i.e. using your website to quickly deploy a questionnaire to relevant people and then tie this information back to their “quantitative” click-stream data.
For example, do people who feel happy about the above use the website more or less than those that do not? Is there a correlation between the type of question/answer and sections of the website they use etc.?
Really good and to the point. When we do digital analytics projects, we always point out that our specialty is “actionable analytics”. Meaning: We only do projects that will change the actual behavior of how the business is run.
And guiding insights towards KPIs like “We spent $36,000 last month on PPC keywords that did not convert.” is a really good example of “actionable analytics” – because every CMO will ask: “How can we lower this number?”
Thanks for input Bjoern
Perhaps the best article I have read on web analytics anywhere! Unless you get this right, everything else is a waste of time, effort and money.
Thinking about my own experience and from all the anecdotes I’ve ever heard (from analysts and from business stakeholders), whenever analytics doesn’t gain traction in an organisation, it mostly seems to come down to two things:
Either:
(a) business stakeholders were not involved in setting objectives, goals and KPIs at the outset, so KPIs do not accurately reflect what the stakeholders understand as critical to the organisation’s success,
or:
(b) the analyst has not fully understood the KPIs or what is truly critical to the business and may misinterpret ‘signals’, which may well be very useful and interesting, as information (or ‘insights’) that can drive strategic change.
In either scenario, the outcome will be misunderstanding, disharmony and frustration. And what is the point of that?
Getting this right from the start is the key to success.
Agreed and thanks for the feedback @Murray. I would add…
a) a common mistake in bringing in stakeholders is they tend to be from the “same” department i.e. form the budget holder of the digital analytics account. Stakeholders need to be broader than that…
b) KPI versus Signal is so often misunderstood – this is because of a)
Excellent article! Thank you